
By Shria Pallati
Abstract
This article examines India and China according to the Solow Growth Model, which sees how capital stock, growth in the labor force, and technology affect an economy’s output of goods and services. The investments into the countries’ economies are different and occurred at different times, and combined with existing labor, historical, and resource constraints, has resulted in diverging growth paths. China is seen to need greater investment in human capital, while India must increase its savings and standard of living. The Solow model is only one of many macroeconomic models, and must be analyzed in conjunction with others for more robust evaluations.
Introduction
The Solow growth model is a macroeconomic tool that sees how capital stock, growth in the labor force, and technology affect an economy’s output of goods and services. We will be looking at the former two in this analysis. On paper, the Solow model assumes a production function that depicts an economy that gives constant returns to scale, and when understanding capital stock, we look at savings and depreciation and growth of population. China and India are two countries that can generally follow the ideas of the Solow model with their large and growing population, and their economy’s growth times are relatively similar, and so make for good comparison.
China
Both China and India have somewhat close histories that make for good comparison. Both were wealthy in land and resources before succumbing to colonization and war. They also both have large populations, the first and second largest in the world. China has had a strong story that really begins with reforms made in the 1970s. China, originally, was quite isolated. It had faced an economic crisis due to trading with the Soviet Union. They did this as they were in need of machinery, but as time passed and they realized that their quality of life was decreasing due to low trade, the CCP, following the Cultural Revolution, opened up China for free trade and to the open market. That income from foreign trade and other various governmental and social policies were the reason for China’s coveted economic boom.
One thing we can look at is the rapid investment as a result of the growing economic policies in China. The Solow model assumes saving and population growth to determine the steady-state level of income per capita. In the 1990s and so on, China’s GDP growth has stayed around 9%, with few occasional highs and lows, and occasionally, even going up by 13%. The 1990s gave Hong Kong to China’s benefit, as it was a coastal place and could supply “not only capital…but management skills and market access that China still lacked”. This was because Hong Kong had been colonized by the British until that time, and this meant that they had access to many offshore markets that China could tap into. They, at that time, were focusing investment in coastal areas for exportation, and also relied on cheap labor for these goods. Before this worldwide notice due to the economic boom, China invested heavily in local village enterprises, stimulating domestic production of essential goods like steel, cement, and farming equipment. Currently, there is also heavy investment in state-owned enterprises and foreign investment that increases innovation.
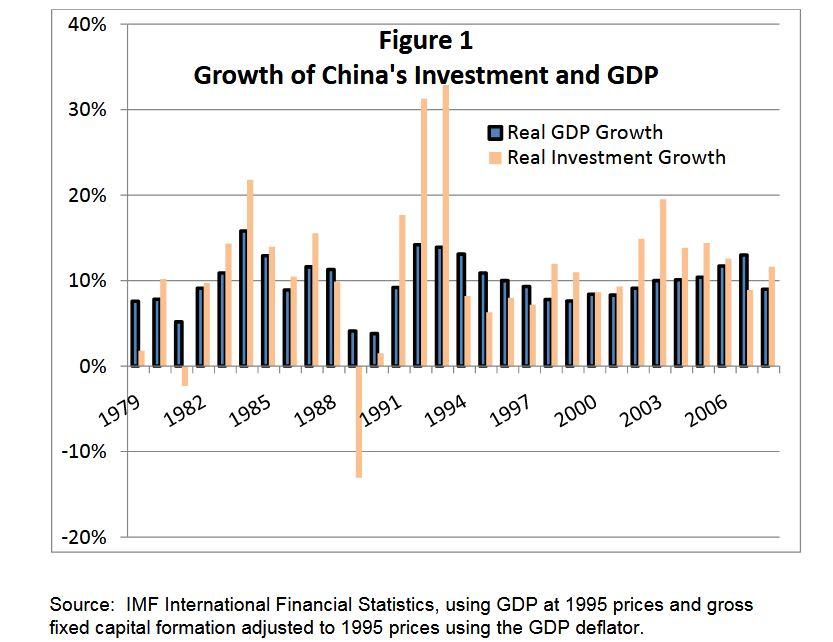
Additionally, there has been significant saving by the government. Investment “increased steadily from 29 to 42% of GDP over 1980-2010”, and we can see that even from 2010-18, though there has been a decrease in investment, it is lower than needed and much higher than competing countries, averaging between 30-35%.
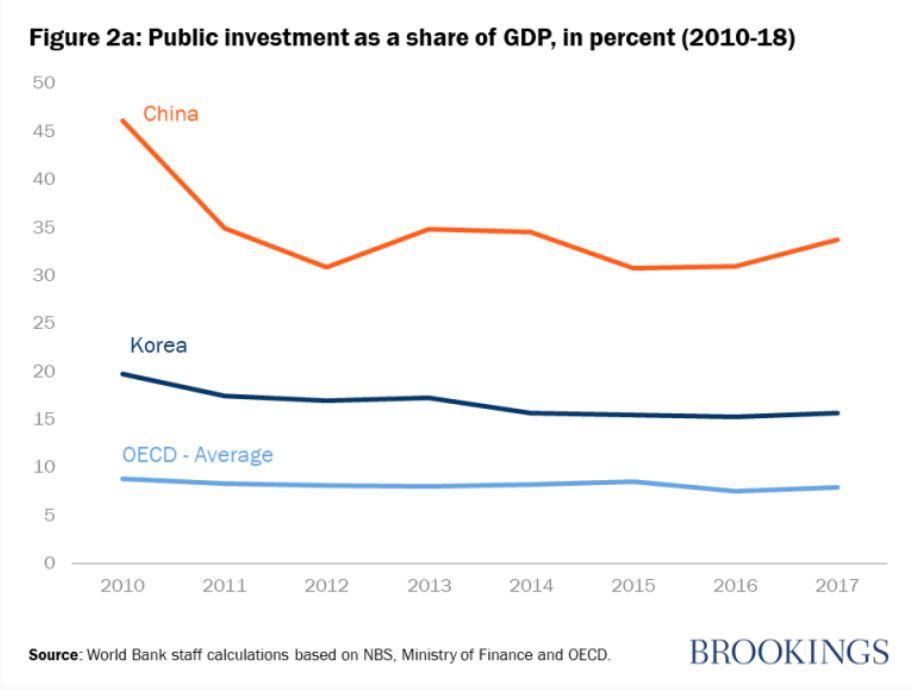
Public Investment from GDP, 2010-18
This economic growth that China faced due to investing is in line with the Solow model. The Solow model states that is the saving rate is high (which implies a higher rate of investment), then the economy has a large capital stock which leads to a higher level of output in the steady state.
There has also been high population growth, which led to more Chinese worker. This, coupled with high capital investments, led to an increase in productivity. Between 1979-94, “productivity gains accounted for more than 42% of China’s growth”. These productivity gains are due to rising capital per worker. From 1982-97, per capita income nearly quadrupled. This also falls in line with the Solow model, as it states that population growth will lead to steady state growth in total output. However, it does not in that capital per worker has increased due to the good economy. Also, population growth in China is difficult to measure, as there have been multiple policies to limit population growth intentionally, like the One-Child Policy, that has affected the working population over the years, and population statistics are not always reliable due to undocumented workers and government corrections. There have been claims from other economists worldwide, particularly in the west, who also have disputed claims of China’s GDP, claiming that the government was overcompensating and inflating numbers, some that China has admitted to.
However, many analysts believe that constant increasing investment is not sustainable. As the Solow model predicts, as was stated previously, the investments leading to increased output has shown declining returns to physical capital. If depreciation exceeds investment, returns lower and growth will slow down, which is what economists are worried about. They recommend that growth should be brought about in other ways. For example, China’s labor force, its working population has started to stabilize and is expected to decline.
In the graphs below, we see how the Solow model does not fully tell us of China’s economic growth; there is low labor productivity and we see that there is more investment than required or advised according to the model (bottom right), and consumers must consume more (bottom left) to reflect the economic growth. This data is from 1980 to 2005, but the trend has continued till current times, as economists continue to advise China to still do the same.
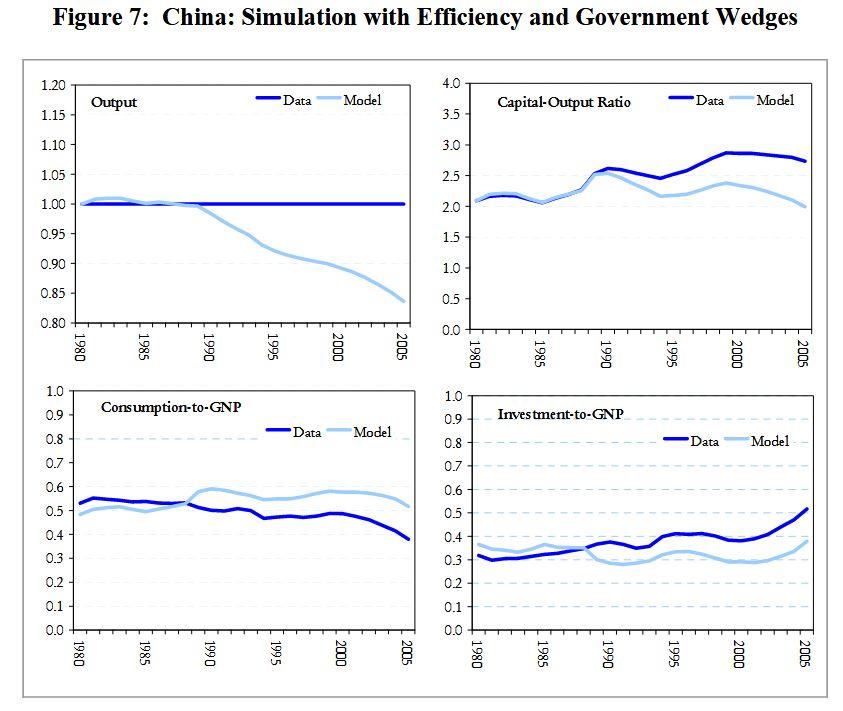
Solow Growth Model China vs China Reality, 1980-2005
To sustain growth, investments in human rather than physical capital may need to be made, as this will bolster the quality of the workforce and create better output, instead of both physical and human capital stagnating. Currently, China will need to increase its investment to compete with other countries.

China’s social spending on GDP, 2010-18
India
India’s growth story really starts after independence from colonization in 1947, and specifically from 1991, when India introduced itself to the global market, and removed controls on foreign investments and exports. They reduced tariffs and interest rates, encouraging FDIs. Just like China, this slow liberalism and acceptance of the foreign market is a main reason for India’s economic development.
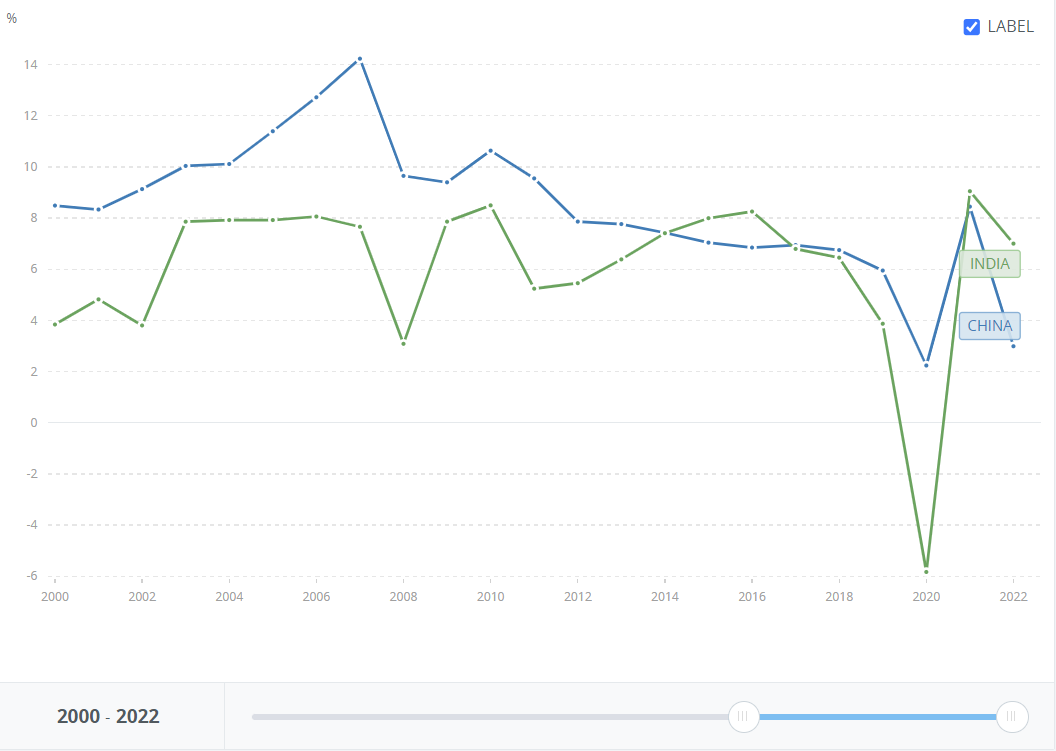
If we look at investment in India, we can see how well it follows what the Solow model expects. Barring 2020, where there was worldwide economic shock due to the COVID-19 pandemic, India’s real GDP growth has remained fairly constant between 6-7%, lower than China’s, except for the recent Chinese slowdown.
Despite having a similar population, the makeup of the two countries is very different. India’s GDP comes from various sources. Services make up about 49% of the GDP, while industry makes up about 25%, and agriculture, which was once India’s main source of production output, grants about 16% of the GDP as of 2022. There are other sources of output, though they are not as organized as these three. Currently, India has an annual population growth of 1%, and it has been steadily decreasing from 2% in 2000. Despite this, India is the second largest populous country in the world, and has a significant young population, either currently working age or primed to become working age in a few years. And its rate is much higher than other countries struggling with their birth rate.
India’s Gross Savings Rate measured at 30.2% in 2021-22. Generally, the depreciation rate for many assets has remained lower than the savings rate, which means there will be continued economic growth, according to the Solow growth model.
As with China, large capital stock will lead to higher level of output in the steady state. Despite the reduction over time, India is still quite high in population growth compared to other developing countries. According to the Solow model, economies with a high rate of population growth should have lower levels of capital per worker. This will lead, overall, to lower incomes.
This falls in line with India’s situation. GDP per capita in India was around $2,388.60 in 2022. This is severely low compared to China’s $12,720.20. With PPP by the current $ (purchasing power parity, which also takes into account cost of living instead of only exchange rates), China $21,475.60 and India is about $8,379.10, still very low.
There are reasons for India’s lower standard of living, like low access to education and technology for many under a certain income born of a certain class. Additionally, though is good population growth, many are not in the workforce, or are not being compensated properly. Unemployment in India in is 7.1%. There are also many unregulated and unorganized markets in India, which may not provide accurate information on the working population and their income, and the total contribution to the economy’s output.
India has also improved its poverty rate, “extreme poverty declined by 12.3 percentage points between 2011 and 2019” It is estimated that it can pull the last 10% of its population out of extreme poverty within a decade. China, when trying to pull itself out of poverty, imposed the One-Child Policy to reduce population growth so that income per person could increase.
As with China, the Solow model does not fully explain the reality behind India’s economic growth, as it does not follow it exactly. The data from 1991 is relevant to us, and we see that though there is some correction in later years towards 2005 that would have continued to the current time, India also started far away from the recommended standard Solow model. This has been included to show that though the Solow model tells us of the ideal, efficient economic situation, it is not often reflected in reality, and may diverge at multiple points throughout time.
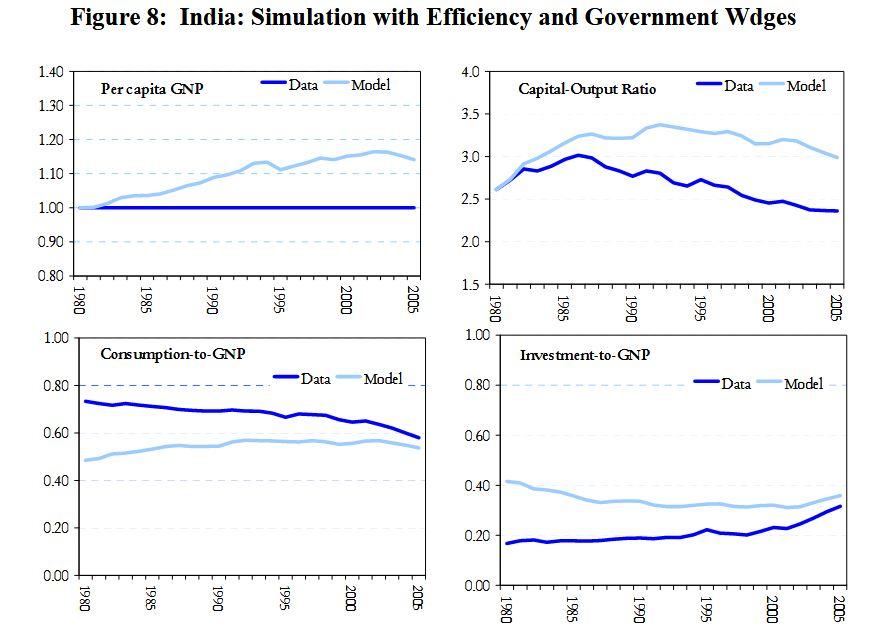
Solow Growth Model India vs India Reality, 1980-2005
As seen previously, China’s economic growth relies heavily on physical investment, as it has done throughout history from the 1970s. India’s economic story starts heavily at 1991, and it has followed a similar Solow model as China, despite its economy makeup and investments being different. Both are expected to have continued economic growth, though China must try and change its direction of investments to some human capital if it is to continue growing faster and efficiently. India must continue to increase its standard of living and saving from the government’s side, as with the low income per capita, the consumers may not be able to save much. The Solow model also does not tell us the full story of these countries, and additional explanations should be used to understand their economic growth.
Author’s Bio
Shria Pallati is a post-grad student studying economics and political science. Her interests lie in inflation/recessions, public choice theory, and economic and political institutions.
Image Source: https://www.brookings.edu/articles/a-big-picture-look-at-the-india-china-relationship/
