

By: Rieshav Chakraborty
Abstract
This paper delves into the dynamics of holiday season anomalies in global equity markets, focusing on diverse phenomena such as the Santa Claus rally and the January effect. Utilizing historical data spanning decades, we examine the behaviour of major indexes including the S&P 500, FT30, Nikkei 225, and Nifty 50 during holiday periods. Our analysis encompasses both traditional anomalies, like the January effect, and emerging trends such as the Santa Claus rally. Additionally, we investigate the impact of market efficiency, investor behaviour, and tax-loss harvesting on holiday-related market phenomena. Furthermore, our study extends to international markets, exploring correlations and divergences in holiday effects across regions. Insights from this research offer valuable implications for investors, policymakers, and market regulators seeking to understand and navigate seasonal patterns in global equity markets.
Introduction
The holiday season is often associated with unique patterns in financial markets, including fluctuations in trading activity and changes in investor behaviour. One important aspect of holiday seasonality is its potential impact on stock market volatility, which can have significant implications for investors and market participants. Understanding how holidays influence market volatility is crucial for risk management, portfolio diversification, and market regulation. In this article, we aim to investigate the effect of holiday seasonality on stock market volatility, focusing on seasonal patterns in trading activity and their implications for market dynamics.
Santa Claus Rally
The Santa Claus rally is a notable phenomenon in the stock market, characterized by an increase in stock prices during the final five trading days of December and the initial two trading days of January. Initially analyzed by Sidney B. Wachtel as early as 1942 using the DJIA, the term “Santa Claus rally” gained popularity when mentioned by Yale Hirsch in “The Stock Trader’s Almanac” in 1972. Over time, the rally’s nature has evolved, initially involving a rise before the holidays followed by a sell-off, but later shifting to a more sustained upward movement lasting around eight days during the late 1960s and 1970s.
Historical data confirms the existence of this rally, with the S&P 500 typically experiencing an average gain of 1.7% during this seven-day period since 1969. This trend has been observed in over 75% of instances since 1950. Recent years have generally upheld this pattern, with the S&P 500 reaching new highs in 2021. However, exceptions like the absence of a rally in 2022 occurred due to concerns over economic recession and banking instability.
January Effect
The January effect, closely associated with the seasonal occurrence of the Santa Claus Rally, denotes the perceived tendency for stock prices to increase during the first month of each year. Sidney Wachtel, an investment banker, is credited with first observing this effect in 1942. The hypothesis implies market inefficiency, as efficient markets would theoretically nullify such patterns.
Analyzing the S&P 500 ETF over 30 years reveals that January experiences slightly more winning months (57%) than losing ones (43%). Despite the robust market rally since 2009, the distribution of positive and negative January months has remained evenly split, defying expectations.
Some suggest that the January effect arises from investors selling off securities at the end of the year to offset capital gains and minimize tax liabilities, followed by a subsequent repurchasing of stocks in the New Year, leading to increased demand and higher prices.
Another explanation involves investor psychology, with some viewing January as an opportune time to initiate investment strategies or fulfil New Year’s resolutions to start investing.
Additionally, the practice of mutual fund managers buying top-performing stocks and shedding underperforming assets, known as “window dressing,” has been proposed as a contributing factor, although its impact is debated, particularly as it pertains to small-cap stocks.
Firm Size
The January effect primarily impacts smaller firms, and the weekend effect is more pronounced in smaller firm stocks compared to larger ones.
Keim (1989) proposes that systematic buying and selling behaviour by investors accounts for the notably high returns on trading days leading up to holidays. If closing prices two days before the holiday are typically recorded at the bid while prices on the holiday itself are recorded at the ask, these systematic trends would result in the observed high returns on the day before the holiday. This effect is likely more significant for smaller-firm stocks due to their relatively larger bid-ask spreads.
S&P 500 (USA)
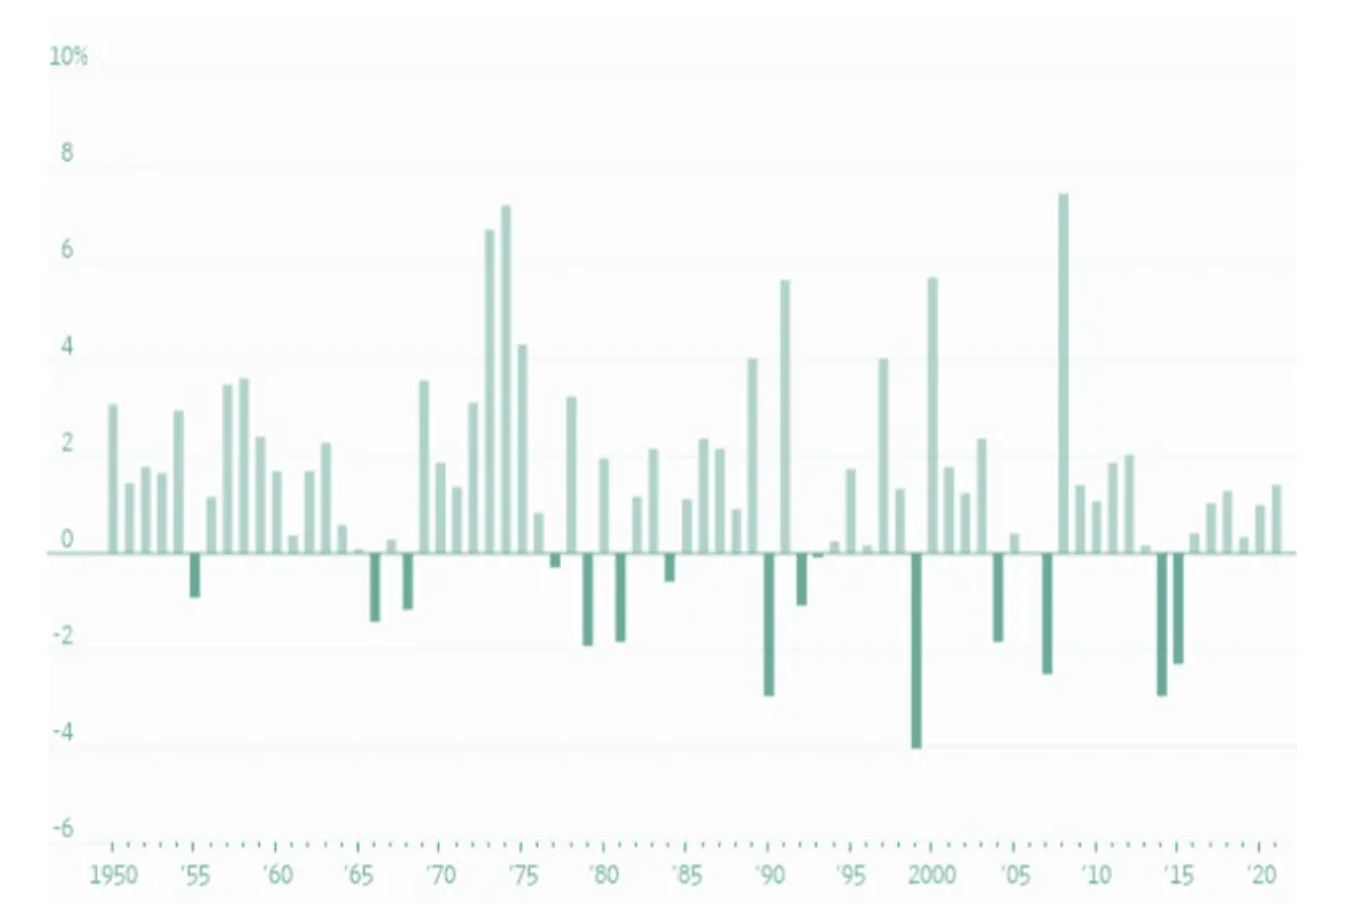
Since 1950, the S&P 500 has typically gained an average of 1.32% during the Santa Claus rally, with positive trades occurring approximately 78% of the time. Similarly, the Dow Jones Industrial Average has seen an average increase of 1.38%, with positive occurrences at a rate of 79% since 1950, highlighting the rally’s historical reliability.
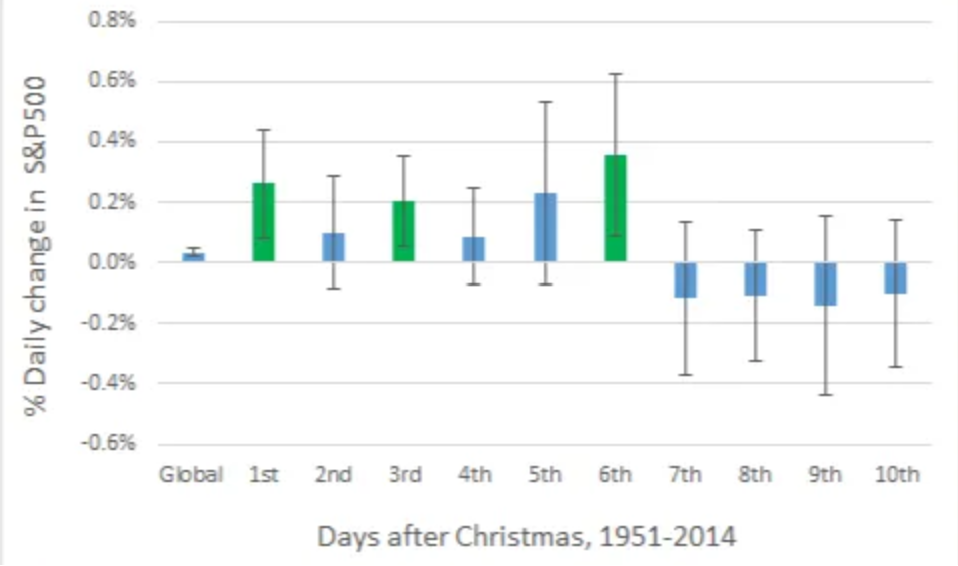
Using t-statistics of econometrics and Integrating 95% confidence intervals into the analysis provides additional insights. Only gains on the first, third, and sixth days after Christmas significantly surpassed the overall average, indicating uneven bullishness across post-Christmas trading days. Moreover, contrary to expectations, the initial four days after Christmas exhibited less variability compared to the subsequent six days.
Historically, the US stock market has been influential globally, with positive trends in US stocks impacting international investor sentiment, and vice versa. Following tax loss harvesting at year-end, investors may reinvest funds, boosting stock demand. Additionally, the increasing recognition of the Santa Claus rally prompts investors to buy stocks in anticipation, potentially catalyzing the rally itself.
Japan & UK
In the research paper titled “Holiday Effects and Stock Returns: Further Evidence” by Kim and Park, econometrics models were applied to analyze if index returns in Japan and the UK behaved similarly to US indexes during the holiday season.
Analysis of stock market returns from July 1, 1972, to June 30, 1987, involving the U.K. FT30 and Japanese Nikkei-Dow indices, alongside the U.S. S&P 500 index, reveals patterns around regular holidays in these countries.

Source: Holiday Effects and Stock Returns: Further Evidence
The holiday effect is evident in both the U.S. and Japanese markets during this period. Specifically, preceding Japanese holidays, the mean return is notably higher at 0.1897% compared to ordinary days at 0.0435%.
Similarly, for the U.K. FT30 index, the average return before U.K. holidays stands at 0.2228%, significantly higher than the ordinary daily mean return of 0.0397%. This suggests a correlation in stock return behaviours across these markets, emphasizing the presence of holiday effects beyond the U.S. market.
Nifty 50 (India)
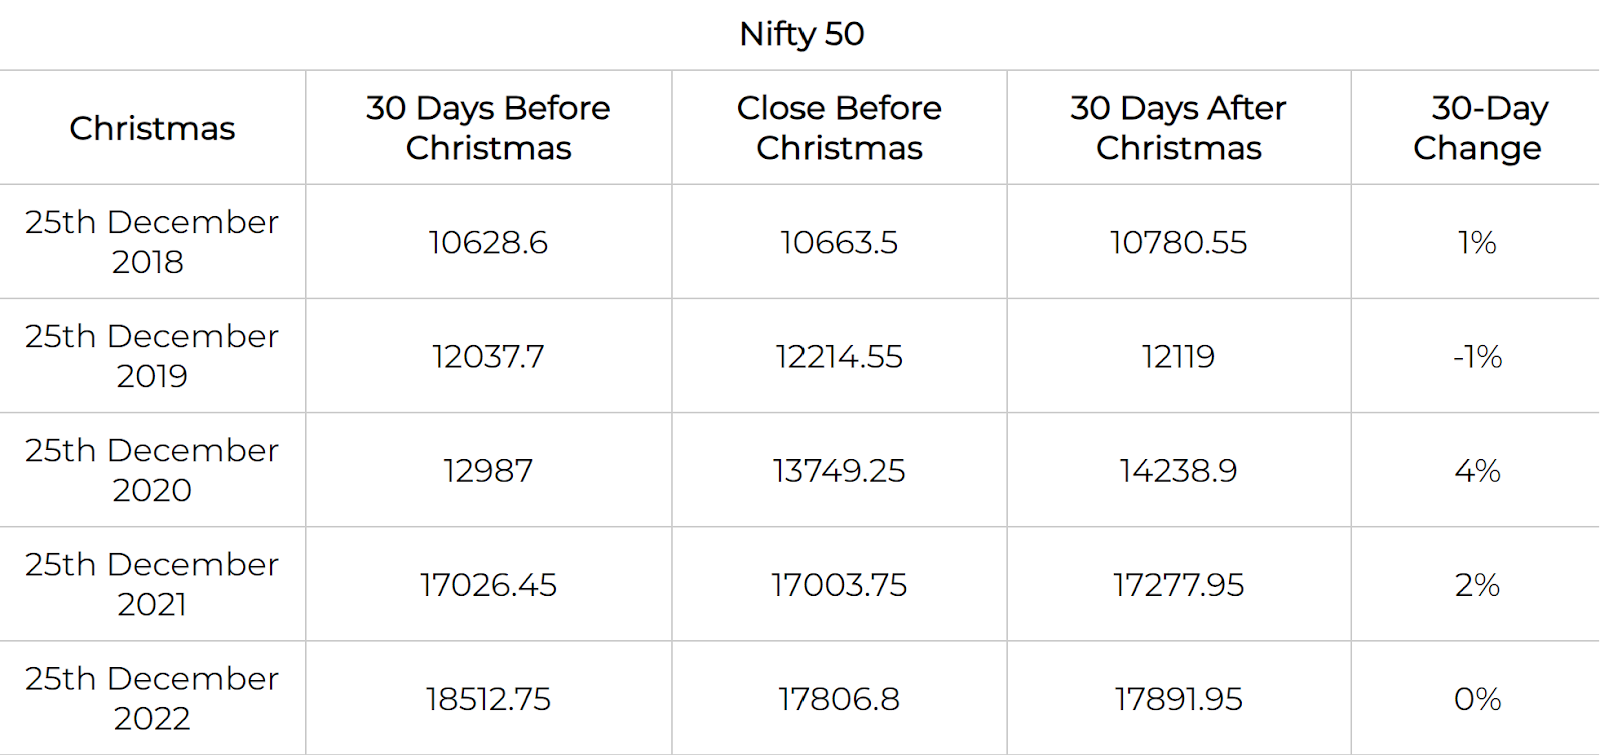
In the past, the holiday season, encompassing Christmas Eve has led to heightened activity and volatility in Indian stock markets. Nonetheless, the overall market performance during this time can fluctuate from one year to another as seen in the above diagram.
Data indicates that the positive sentiment typically observed in the US during this period often extends to the Indian stock market. However, various other factors inherently influence market performance in India, and the occurrence of the rally is not guaranteed annually.
Notably, the Nifty 50 has mirrored movements in the S&P 500 on numerous occasions. Over the past 16 years, the Nifty 50 experienced the Santa Claus rally in 13 instances, showcasing a robust year-end performance consistent with the global trend. According to The Economic Times, from 2001 to 2021, the Nifty yielded an average return of approximately 2% during the seven-day Santa Claus rally period.
Security Indices
In a recent study titled “Exploring the Holiday Market Anomaly: Insights from Global Equity Indexes,” six financial markets including the JSE Index, CAC 40 Index, DAX Index, NASDAQ Index, BIST100 Index, and Nikkei 225 were examined. The study, conducted in December 2023, analyzed daily market prices from June 12, 2018, to June 12, 2023, using econometric tools (t-tests, hypothesis testing etc) to explore the phenomenon.

Source: Exploring Holiday Market Anomaly
As seen in the image above, the standard deviation varies from 1.23% in the Nikkei 225 to 1.65% in the JSE, with all markets showing a right-biased heavy-tailed distribution in kurtosis. This suggests frequent positive price fluctuations in the JSE, Nasdaq, DAX, CAC 40, and Nikkei 225 over the past five years. Additionally, the volatility across the sampled indexes appears relatively stable, except for the BIST100, which exhibits variability.
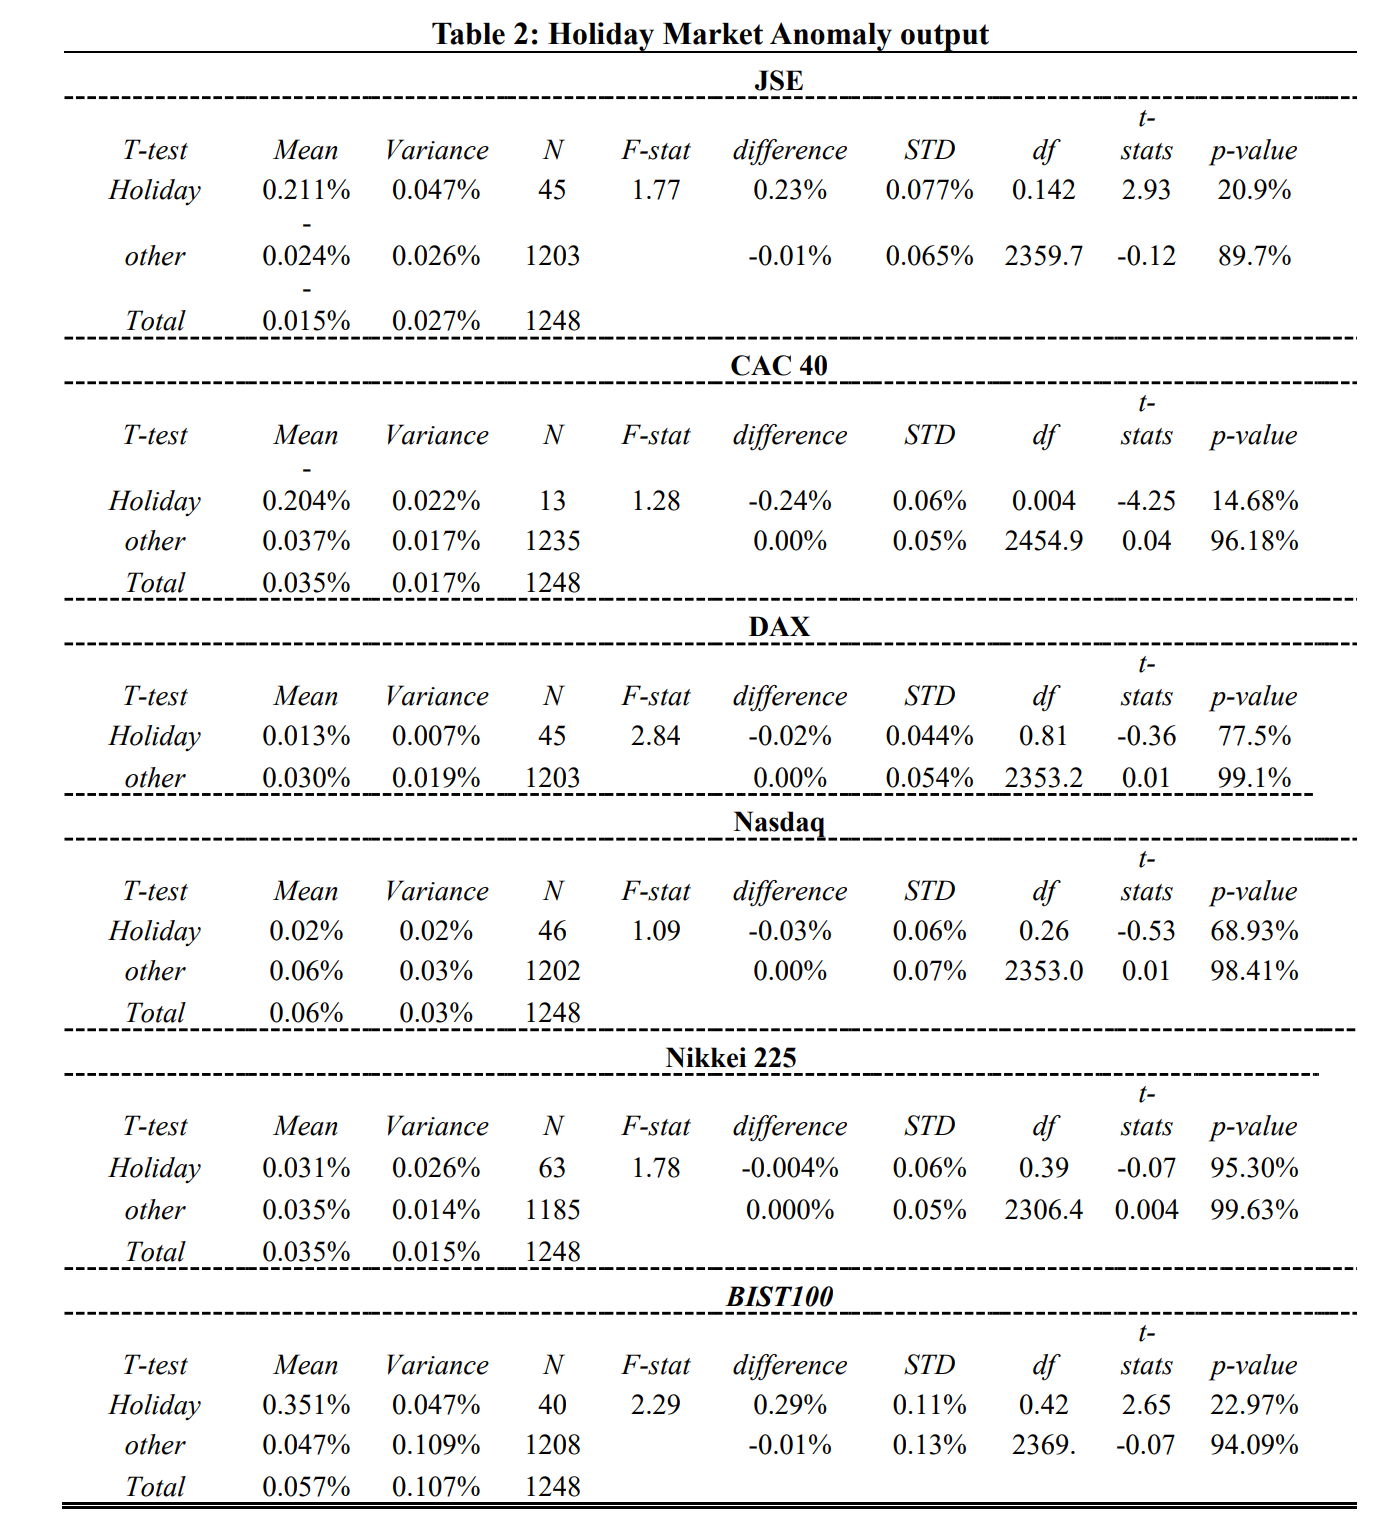
Source: Exploring Holiday Market Anomaly
In contrast to the preceding table, this new table indicates the absence of holiday market anomalies. Across the JSE, CAC 40, DAX, Nasdaq, Nikkei 225, and BIST100, average returns during holidays do not significantly differ from those on other days over the past five years. Notably, the p-values for holiday returns in these financial markets exceeded the 5% threshold, implying the lack of a holiday effect. (P-values below 5% would signify a holiday effect.)
Criticisms
- Diminished significance: Many studies indicate a decrease in the prominence of the January effect. Some speculate that initial observations may not have been entirely accurate, while others suggest that increased investor awareness led to strategic adjustments, diminishing the effect’s impact over time. This implies that the January effect might be more of a historical anomaly than a reliable market indicator.
- Market efficiency: According to the efficient market hypothesis, outperforming the stock market is improbable as it swiftly incorporates all pertinent information. With the rise of high-frequency trading and advanced algorithms, any momentary anomalies, including the January effect, would be swiftly identified and rectified.
- Relation to small-cap stocks: Certain studies highlight the January effect’s presence in small-cap stocks, which are typically more volatile and risky. However, this raises doubts regarding the general applicability of the effect across various market segments and the feasibility of generating risk-adjusted returns through its exploitation.
- Issues with the tax-loss harvesting hypothesis: The January effect has been attributed to investors selling securities at a loss in December for tax purposes and repurchasing them in January, potentially inflating prices. Critics argue that this behaviour’s consistency varies annually, and individual traders’ tax circumstances and broader economic conditions also influence it.
About the author
Rieshav Chakraborty is a 2nd -year student at the Jindal School of Government and Public Policy, pursuing BA (Hons) Economics. His research interests include Behavioral Economics, Environmental Economics, and Development Economics.
Image Source: Trade Station
